Custom Widgets

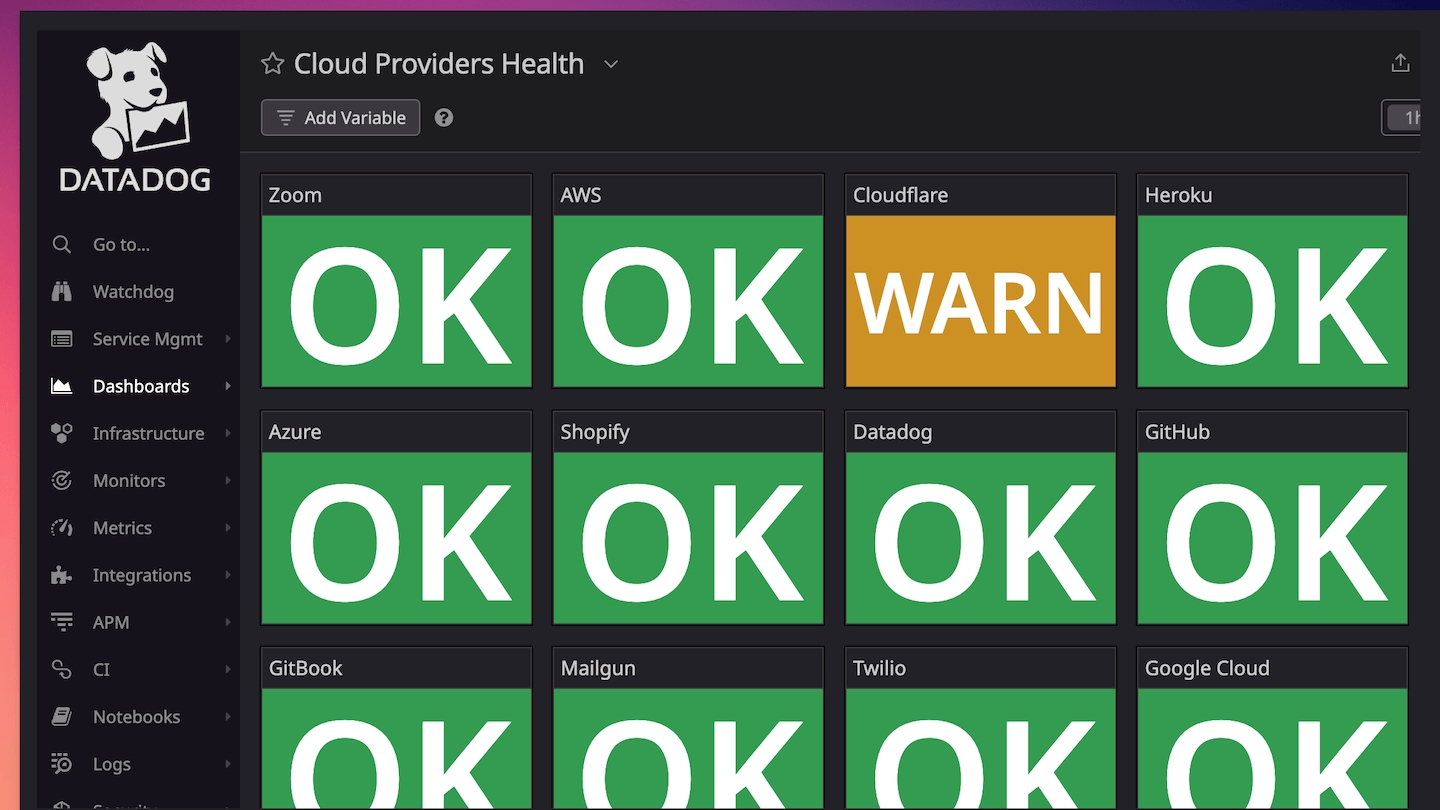
By default, IsDown creates a dashboard with some useful widgets that are more focused on real-time data and trying to understand what's wrong with your vendors quickly.

On this page, we'll list other widgets that should be available with the current data set sent from IsDown to Datadog.

Services with the most outages

How to add the widget?

Click the "Add Widgets" button, choose the Treemap widget, then click JSON in the "Graph your data" and paste the following JSON code.

{
    "viz": "treemap",
    "requests": [
        {
            "response_format": "scalar",
            "queries": [
                {
                    "data_source": "events",
                    "name": "query1",
                    "indexes": [
                        "*"
                    ],
                    "compute": {
                        "aggregation": "cardinality",
                        "metric": "@evt.id"
                    },
                    "group_by": [
                        {
                            "facet": "@aggregation_key",
                            "limit": 100,
                            "sort": {
                                "order": "desc",
                                "aggregation": "cardinality",
                                "metric": "@evt.id"
                            }
                        }
                    ],
                    "search": {
                        "query": "source:isdown status:(warn OR error)"
                    }
                }
            ],
            "formulas": [
                {
                    "formula": "query1"
                }
            ]
        }
    ]
}

Number of outages by time and service

How to add the widget?

Click the "Add Widgets" button, choose the Timeseries widget, then click JSON in the "Graph your data" and paste the following JSON code.

{
    "viz": "timeseries",
    "requests": [
        {
            "style": {
                "palette": "semantic",
                "type": "solid",
                "width": "normal"
            },
            "type": "bars",
            "formulas": [
                {
                    "formula": "query1"
                }
            ],
            "queries": [
                {
                    "data_source": "events",
                    "name": "query1",
                    "indexes": [
                        "*"
                    ],
                    "compute": {
                        "aggregation": "cardinality",
                        "metric": "@evt.id",
                        "interval": 86400000
                    },
                    "group_by": [
                        {
                            "facet": "@aggregation_key",
                            "limit": 10,
                            "sort": {
                                "order": "desc",
                                "aggregation": "cardinality",
                                "metric": "@evt.id"
                            }
                        }
                    ],
                    "search": {
                        "query": "source:isdown status:(warn OR error)"
                    }
                }
            ],
            "response_format": "timeseries"
        }
    ]
}

Last updated